
REPORT
Q2/H1 2026 Hotel Labor Costs Report
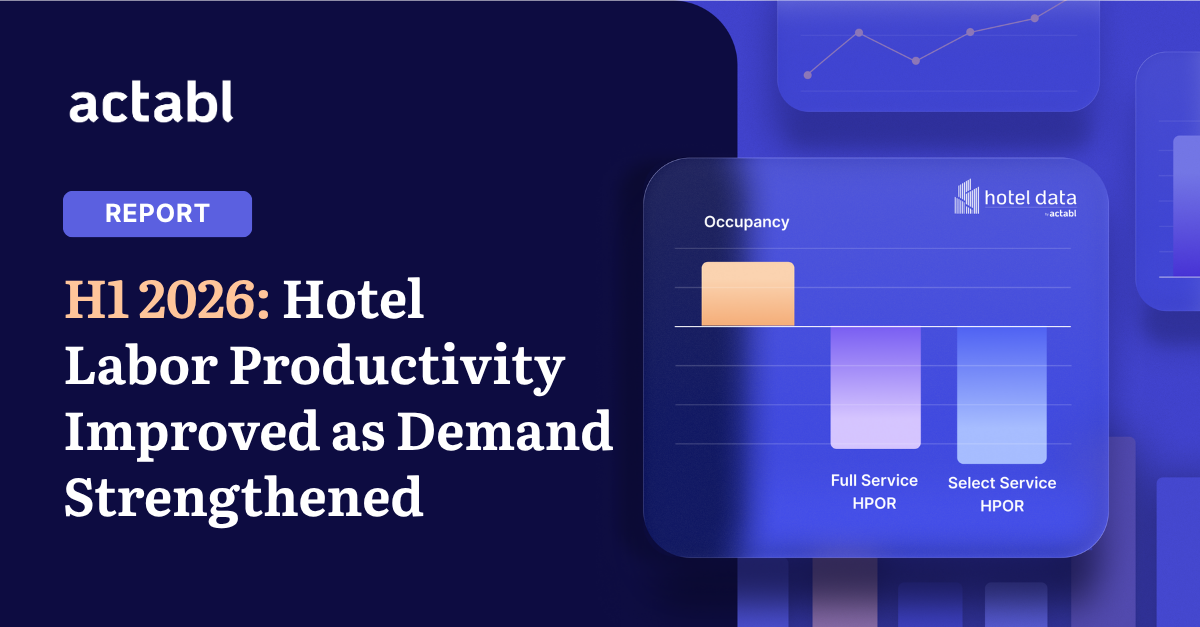
Download the latest HotelData.com labor report for a clear view of how Full Service and Select Service hotels flexed hourly labor as demand strengthened in H1 2026.
Why it matters
Hotel demand strengthened in H1, but labor hours per occupied room fell across Full Service and Select Service hotels. The report shows where productivity improved, where wage pressure persisted, and where lower labor intensity did not fully translate into lower cost.
Download the report to learn:
- How H1 HPOR changed for Full Service and Select Service hotels
- Which hourly housekeeping roles delivered the strongest MPOR gains
- How wage growth compares with productivity improvement


Smarter operations start here.
Discover how Actabl drives savings, accurate forecasting, and higher staff retention.
Discover how Actabl drives savings, accurate forecasting, and higher staff retention.