Stronger Revenue Is Reaching the Bottom Line, But Profit Performance Remains Uneven
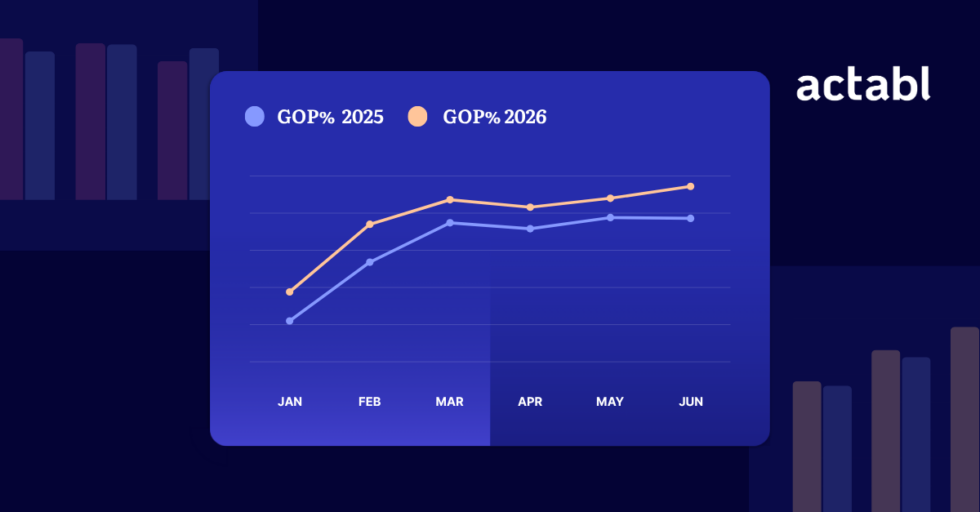
Hotel profits have seen a strong rebound in the first half of the year, with gross operating profit margin (GOP%) up 3.6 percentage points year over year, from 41.3% in H1 2025 to 44.9% in H1 2026, according to the latest report from HotelData.com by Actabl.
Analyzing aggregated data from thousands of hotels using our ProfitSword business intelligence platform, the H1 2026 Hotel Profitability Report found that profit improvement accompanied stronger demand and revenue. ADR increased 7.1%, RevPAR rose 8.9%, and TRevPAR increased 9.2%. Occupancy also improved by 1.1 percentage points.
Taken together, the numbers tell an encouraging story: hotels generated more revenue from available inventory and retained a larger share of operating revenue as gross operating profit.
Q2 maintained the profit momentum
Improvement built as the year progressed, with Q2 data showing an even stronger rebound on 2025. In Q2, All Hotels RevPAR increased 9.4% year over year, while TRevPAR grew 9.2%.
At the same time, GOP margin rose from 43.9% in Q2 2025 to 47.2% in Q2 2026, a gain of 3.3 percentage points.
The connection between revenue and profit matters. Revenue growth creates an opportunity for profit improvement, but it does not guarantee it. Higher occupancy can create additional housekeeping and labor costs. Stronger F&B revenue requires staffing and product costs. And higher guest volumes increase demand for utilities, laundry, supplies, maintenance, and service.
The question for operators is not simply whether revenue grew. It is how much of that incremental revenue reached the bottom line.
Within the ProfitSword sample, H1 suggests operators became more effective at making that conversion.
Luxury delivered the strongest combination
H1 Luxury ADR increased 10.1%, occupancy improved 3.4 percentage points, RevPAR climbed 15.9%, and TRevPAR rose 15.1%. GOP margin increased four percentage points, from 34.6% to 38.6%.
Luxury hotels therefore achieved something many operators struggle to deliver at the same time: stronger price, greater volume, higher total guest revenue, and improved profitability. That combination gives operators greater room to absorb rising operating costs.
It also demonstrates the value of looking beyond rooms revenue. Luxury hotels often have larger F&B operations and wider ancillary revenue streams. When those areas perform well alongside guestrooms, the hotel has more opportunities to generate incremental profit. The challenge is ensuring that the cost structure does not outpace the revenue opportunity.
Economy shows why occupancy alone is not enough
Economy hotels provide the counterpoint. H1 Economy occupancy increased 4.6 percentage points to 68.5%, the largest occupancy gain among the chain scales in the sample. But ADR fell -9.3%. The result was a -2.7% decline in RevPAR and a -1.5% decline in TRevPAR. GOP margin remained almost unchanged, slipping just 0.1 percentage points.
Economy had demand. What it did not have was the same pricing power. That distinction matters because additional occupancy carries costs.
If rooms are being filled at lower rates, hotel teams need to understand whether the additional room nights generate sufficient contribution after accounting for distribution, labor, breakfast, housekeeping, utilities, and other variable expenses. A busier hotel is not automatically a more profitable hotel.
There was encouraging movement in Q2. Economy RevPAR returned to growth at 3.3%, supported by a 5.7-point increase in occupancy and a much smaller ADR decline than in Q1. The GOP margin also improved by about 1 percentage point.
That suggests the segment moved in a healthier direction as the half progressed, even though the H1 result remained under pressure.
Profit performance varied across the middle market
The middle chain scales also demonstrate that similar revenue results can produce different profit outcomes.
- Midscale RevPAR increased by 4.2% in H1, and the GOP margin improved by 1 percentage point.
- Upper Midscale RevPAR rose 3.8%, with GOP margin up 0.6 points.
- Upscale RevPAR increased 4.7%, while GOP margin improved 0.8 points.
- Upper Upscale stands out. RevPAR grew a more modest 3.1%, but GOP margin improved 2.8 percentage points.
That gap suggests that revenue growth alone does not tell us which hotels are creating the strongest operating result. The efficiency with which teams convert that revenue matters just as much.
Revenue creates the opportunity. Operations determines the outcome.
June brought that lesson into sharp focus. The month marked the kickoff of the FIFA World Cup, leading to periods of exceptional demand in some markets.
All Hotels ADR increased 11.4%, RevPAR rose 13.1%, and TRevPAR increased 12.2% comparing June 2026 with June 2025 figures. GOP margin reached 48.6%, up 4.3 percentage points from June 2025.
The harder part is making sure hotels are staffed correctly, rates reflect compression, ancillary outlets capture guest spend, maintenance does not disrupt service, and additional revenue flows through efficiently. That requires revenue, finance, and operations to work from a shared view of the business.
Download the Full H1/Q2 2026 Hotel Profitability Report
H1 and Q2 showed a healthy rebound in hotel performance figures for most of the market. But the question remains: can this growth continue through H2?
Download the full H1 2026 Hotel Profitability Report to see:
- How profitability metrics performed across all chain scales
- The role TrevPAR played in extending revenue growth beyond rooms
- How GOP margin rose across H1 and Q2
Subscribe to HotelData now to stay up to date.